
How to Compare IFC Revisions and See What Changed
A new IFC revision arrives. The first question is usually simple: what changed?
For two files, the traditional workflow is straightforward. Load the earlier model, load the new model, compare them and inspect added, removed or modified objects.
But engineering and BIM projects rarely stop at two deliveries. During design development, a team may receive Revision 01, Revision 02, Revision 03 and many more. At that point, the question changes.
It is no longer only:
What changed between the last two files?
It also becomes:
How has the model developed across the complete revision history?
That is the problem addressed by VoxelStudio Model Bridge – IFC Comparator.
From a two-file diff to a revision history
A conventional comparison is an A-versus-B operation. It is useful for checking the latest delivery, but it gives only one snapshot.
A sequence of IFC revisions contains much more information. It can reveal whether the represented model is growing steadily, whether one discipline is changing more rapidly than another, whether a revision contains an unusual number of deletions, or whether the model has entered a period dominated by modifications rather than additions.
Model Bridge analyses the revision sequence as a timeline.
The objective is not to invent a percentage of project completion. Without a defined final scope, saying that a model is “70% complete” would be misleading.
Instead, the comparator measures something directly observable in the files:
how the represented 3D engineering content evolves from revision to revision.
Real example: Revit IFC revision history
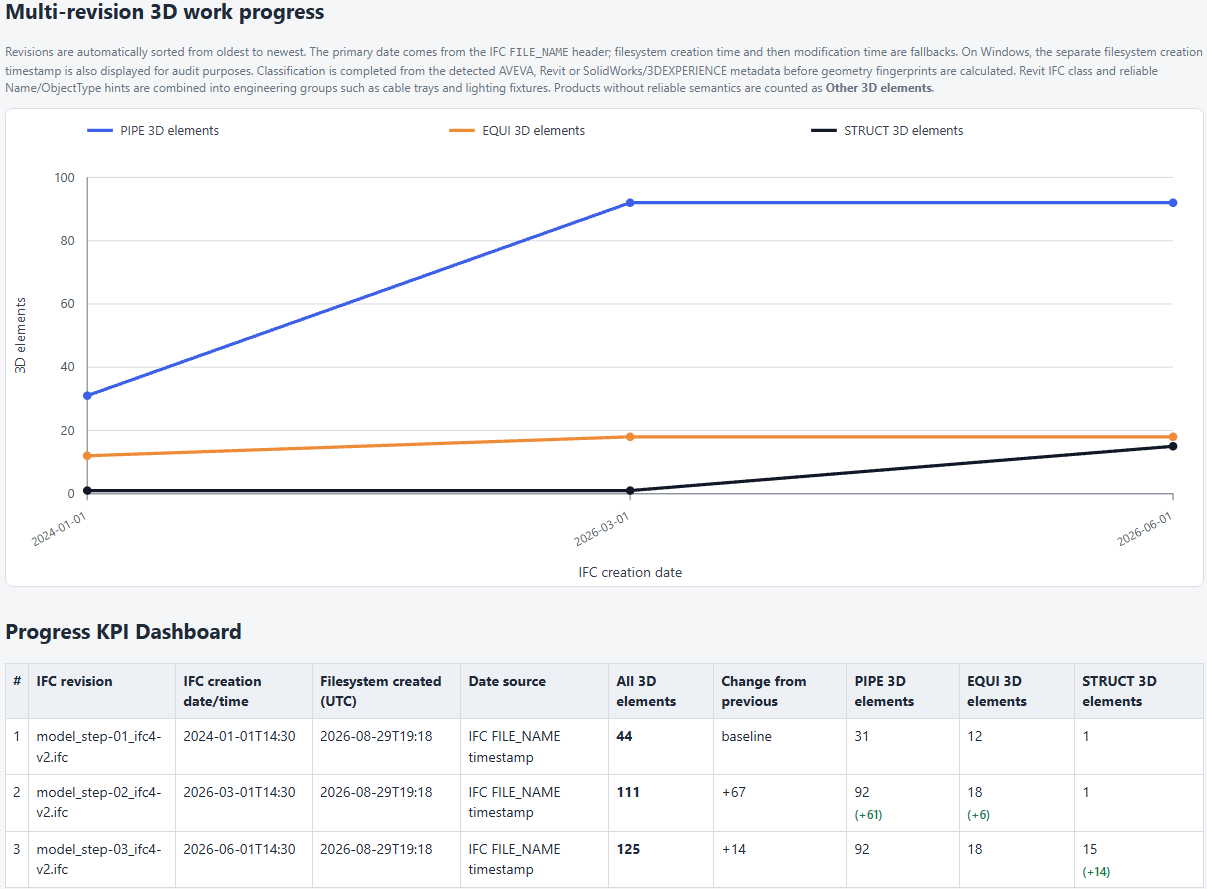
Example of a real HTML KPI report generated from Autodesk Revit IFC revisions containing piping, equipment and construction/structural content.
The report shows the development of unique represented 3D elements over the analysed revision dates.
This kind of view gives a BIM Manager or Design Manager an immediate overview before opening a detailed change table.
A rising curve may indicate new model content. A flat period can indicate stability or a period focused on information development rather than geometry. A sudden fall deserves investigation because it may represent intentional scope reduction, model restructuring or an unexpected deletion.
The graph itself does not decide which interpretation is correct. It provides evidence that tells the project team where to look.
Added, deleted and modified elements
The timeline gives the management-level view. Detailed revision comparison answers the next question: what exactly changed?
For each transition, Model Bridge can classify changes such as:
- Added – represented elements present in the new revision but not in the previous one.
- Deleted – represented elements that disappear from the new revision.
- Modified – elements whose relevant geometry or identity-related characteristics changed.
- Placement changes – represented elements whose position changed between revisions.
These categories make it possible to move from a general KPI to an engineering review.
For example, if the total number of represented elements increases only slightly but the detailed report contains a large number of modified objects, the revision may represent substantial rework rather than simple model growth.
Why not simply count every IFC entity?
An IFC file contains much more than visible engineering objects.
It may contain spatial containers, relationships, representation items, logical hierarchy, assemblies, metadata and objects without their own visible geometry.
That is why the main Model Bridge KPI focuses on unique represented 3D elements rather than a raw count of every IFC entity.
The intention is to create a number that is closer to the model content a BIM or engineering team actually sees and manages.
More detailed IFC information remains valuable, but it should not distort a high-level progress indicator.
Engineering categories make the KPI more useful
A total count is informative, but categories make it actionable.
Imagine that a model grows from 5,000 to 6,000 represented elements. That change becomes much more meaningful when the project team can see whether the increase came from piping, equipment, structural/construction content or another engineering group.
This is especially important in EPC and multidisciplinary design environments, where different disciplines progress at different speeds.
Model Bridge therefore uses source-aware classification where sufficient information is available in the IFC export.
The current release has been developed and tested with IFC exports from:
- AVEVA E3D
- Autodesk Revit
- SolidWorks / 3DEXPERIENCE
The three sources are not identical. Their IFC exports contain different levels of semantic information, so the interpretation logic is adapted to the source rather than assuming that every IFC file looks the same.
Why this matters to BIM and Design Managers
Revision comparison is often treated as a coordination task: identify the latest changes and verify that they are expected.
A multi-revision history adds another layer.
It can help answer questions such as:
- Is modelling activity increasing or slowing?
- Which discipline changed most between deliveries?
- Was there an unusual deletion event?
- Did the latest issue contain new scope or mainly rework?
- Which revision introduced a large package of equipment?
- When did structural or construction content become stable?
- Are repeated revisions showing instability in the same model area?
These are not automatic contractual conclusions. They are measurable signals extracted from the actual delivered models.
That distinction is important. The software does not replace engineering judgement; it gives that judgement better evidence.
A smaller, focused IFC comparison workflow
There are already powerful BIM platforms capable of model comparison, coordination and issue management.
The goal of Model Bridge is different: provide a focused workflow for people who want to open a revision series, analyse it locally, obtain understandable KPIs and export reports without building a large platform workflow around the task.
The first release concentrates on multi-revision IFC comparison and model-development reporting.
Future development will extend the same idea from one revision series to a much broader question: what happens if we analyse all IFC models of an entire project rather than only one subcontractor or one discipline?
That would turn revision comparison into project-level design analytics.
For now, the first step is simple:
take the IFC revisions you already receive and make their history measurable.